17.40%
Technology earns its share.
Technology generates $145,454.95 in profit on $836,154.03 of revenue—the strongest category margin in the sample. Product mix deserves attention alongside sales volume.
Financial & Cost Accounting · 2014–2017
An accounting portfolio that follows the money—from 9,994 retail line items to the decisions behind a healthier business.
Prepared by Atharv · Tableau Sample Superstore · Educational case study
Every dollar has a destination.
01 / Financial snapshot
The total tells one story. Choose a year, category or region to see where revenue becomes profit.
These controls filter the local portfolio summary independently of the Looker dashboard below.
Revenue
$2,297,200.86Sales before derived costDerived cost
$2,010,803.84Sales − ProfitProfit
$286,397.02Revenue retained after costProfit margin
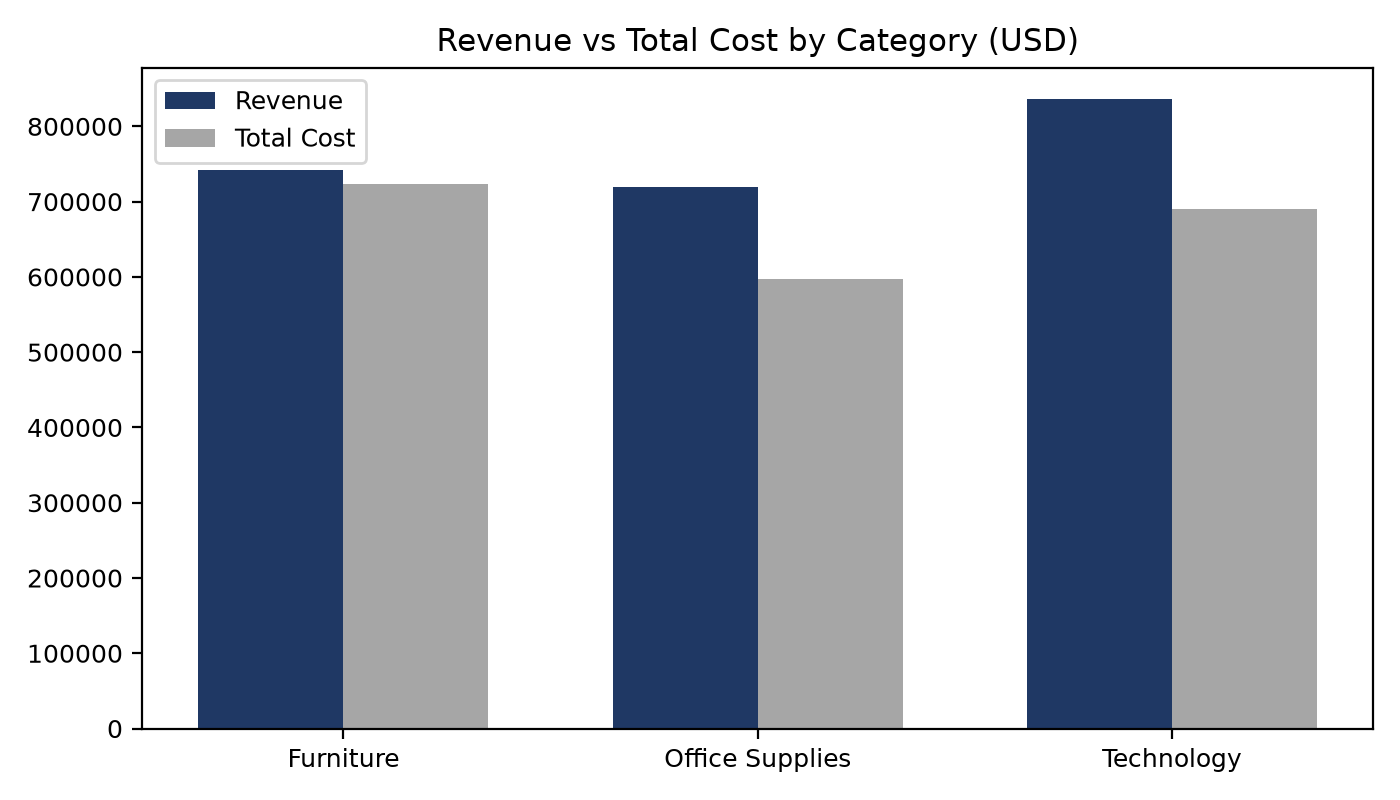
12.47%Sum of profit ÷ sum of revenueAll years · All categories · All regions · 9,994 line items
Margins are calculated from summed amounts, never from an average of individual row margins.
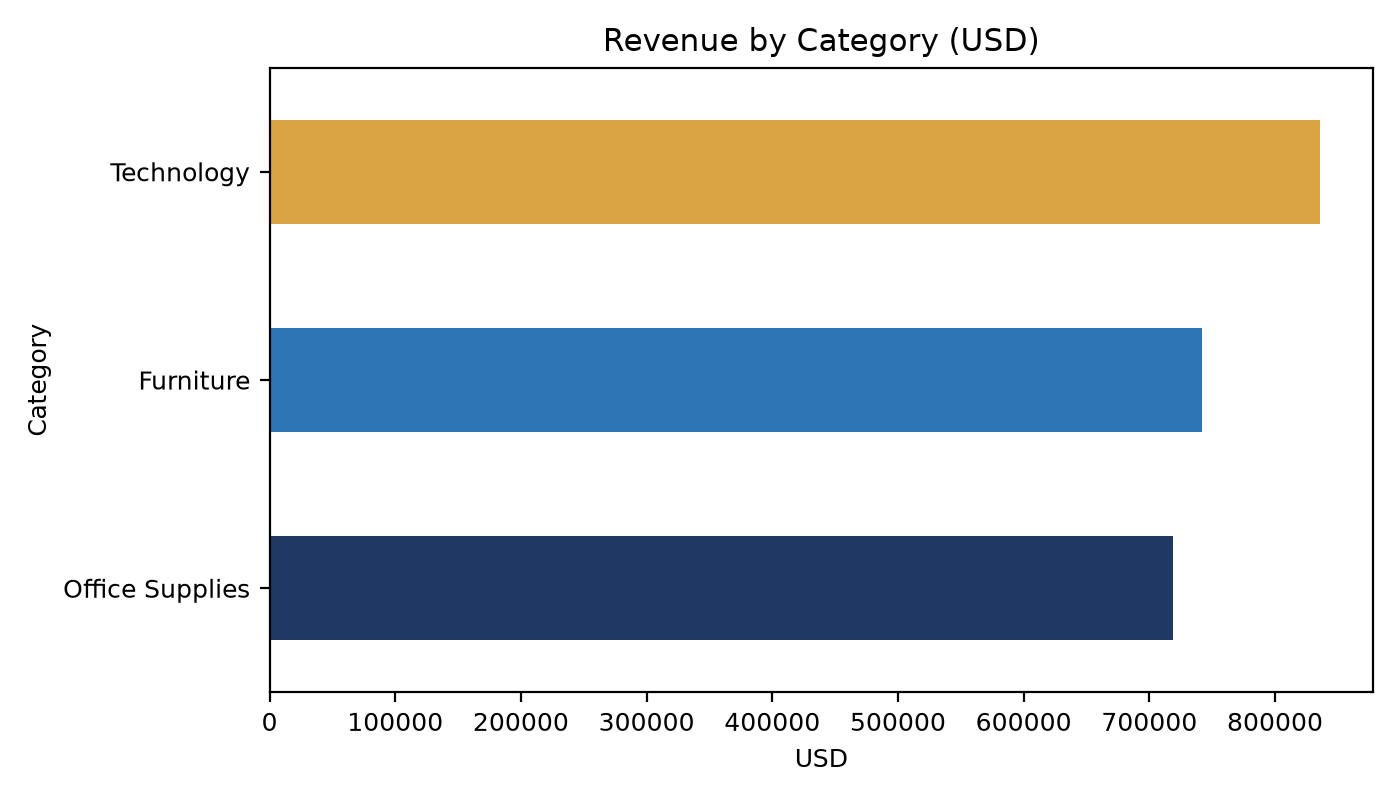
| Category | Revenue | Profit | Margin | Line items |
|---|---|---|---|---|
| Furniture | $741,999.80 | $18,451.27 | 2.49% | 2,121 |
| Office Supplies | $719,047.03 | $122,490.80 | 17.04% | 6,026 |
| Technology | $836,154.03 | $145,454.95 | 17.40% | 1,847 |
02 / The story behind the numbers
Three findings worth carrying from the spreadsheet into a business discussion. These describe the complete 2014–2017 sample.
17.40%
Technology generates $145,454.95 in profit on $836,154.03 of revenue—the strongest category margin in the sample. Product mix deserves attention alongside sales volume.
2.49%
Furniture brings in $741,999.80 of revenue but retains just $18,451.27 of profit. Its scale hides a thin margin; pricing and discounts warrant a closer review.
−$17,725
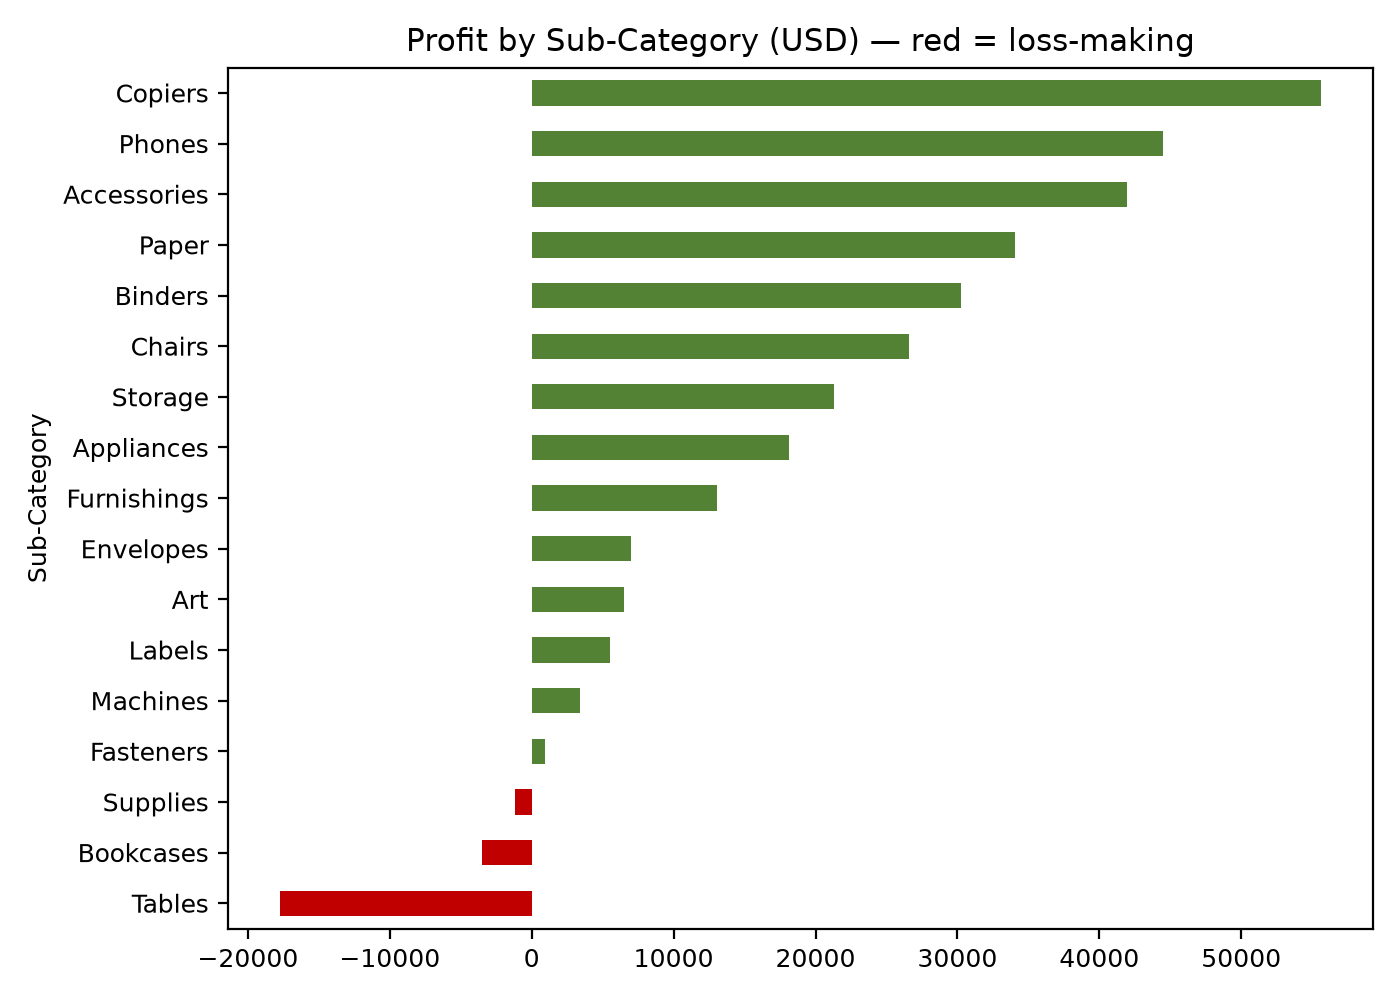
Tables record $206,965.53 of sales and a loss of $17,725.48. Review discounting and product economics before pursuing more volume. Proposed improvements are scenarios, not guaranteed outcomes.
Original portfolio charts · Full dataset
03 / Method & provenance
A clear accounting model makes the findings useful—and makes their limits visible.
Original publisher: Tableau Sample Data ↗Tableau Sample Superstore is a fictitious educational retail dataset. The portfolio covers 9,994 line items dated 3 January 2014 to 30 December 2017. Line items are not distinct customer orders.
Revenue = Sales. Derived cost = Sales − Profit. Profit margin = total Profit ÷ total Sales. The workbook, local explorer and dashboard use the same definitions.
Cost is derived from the provided profit, not sourced from a separate cost ledger. No fixed/variable cost split is available, so a numeric break-even point cannot be responsibly calculated.
The finished workbook passed all nine validation rows. Documents, figures and dashboard totals were cross-checked; the source notes and submission manifest preserve the audit trail.
04 / Live dashboard
Explore the published Looker Studio report with its own date, category and region controls.
Open dashboard in a new tab ↗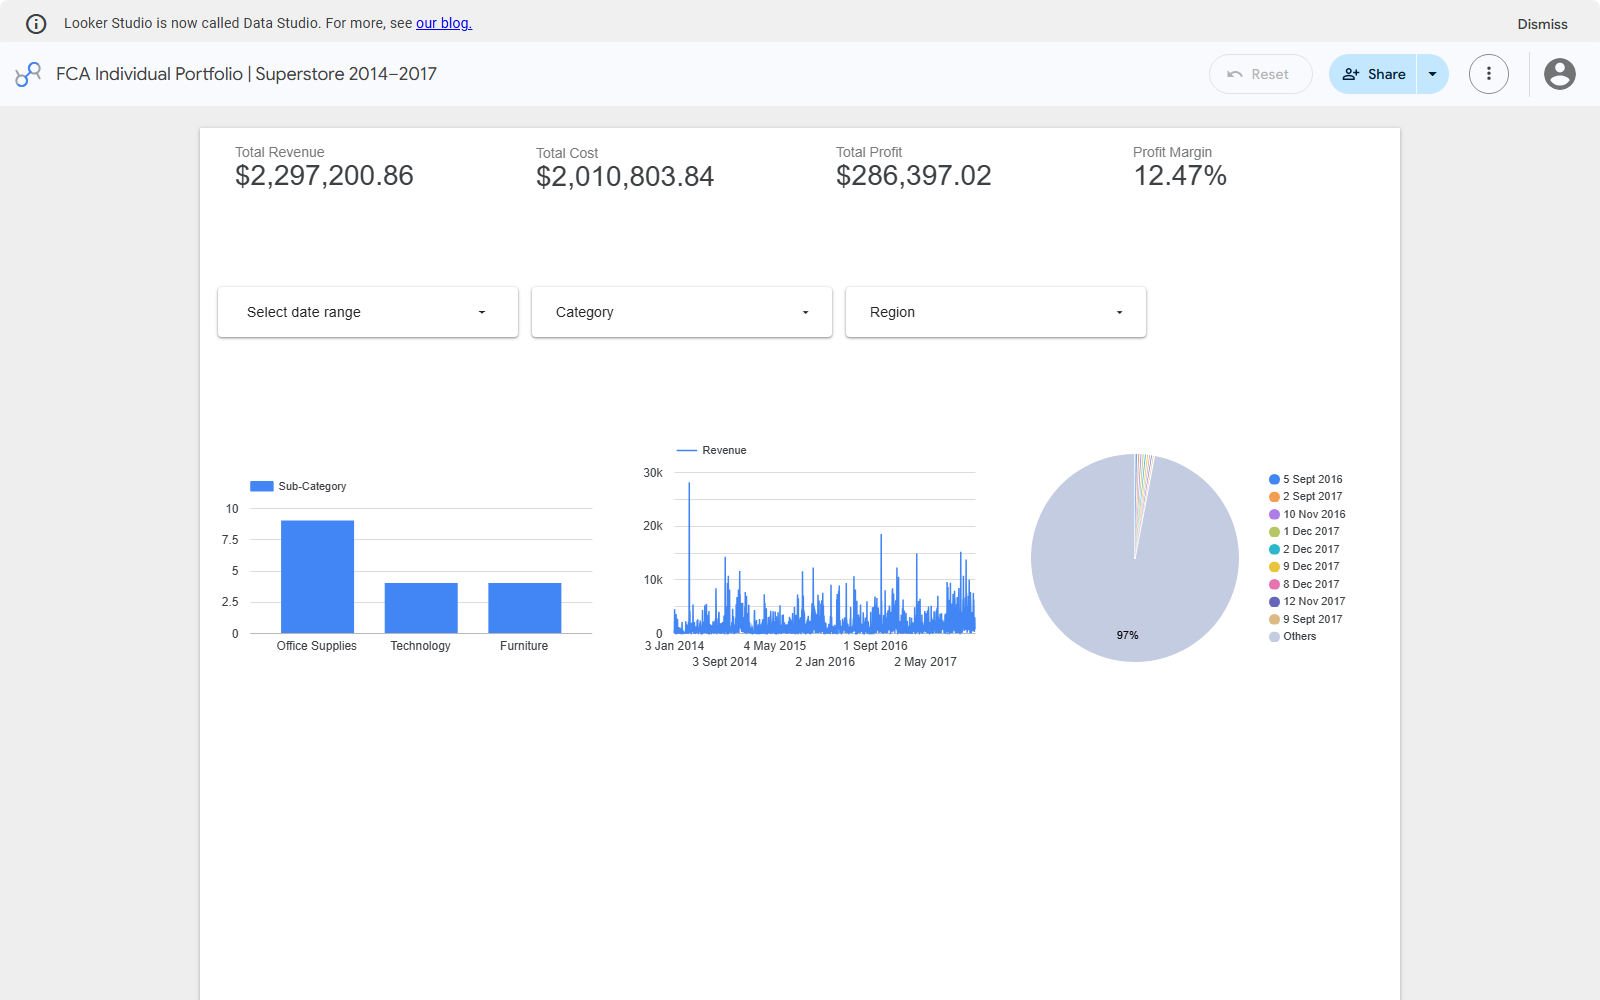
The image is a verified public-view capture. Loading the interactive report connects to Google; if embedding is unavailable, use the dashboard link above.
05 / The complete journal
Read the completed journal in place, or download the PDF for the original submission layout.
14 sections
Journal text is reproduced from the completed editable document. The methodology note above clarifies the educational source and limits of derived costs; proposed financial improvements remain illustrative scenarios.
06 / Evidence, not decoration
Genuine dashboard captures document the live totals and two verified filter checks. Select an image to inspect it.

Revenue, derived cost, profit and margin match the independently verified dataset totals.
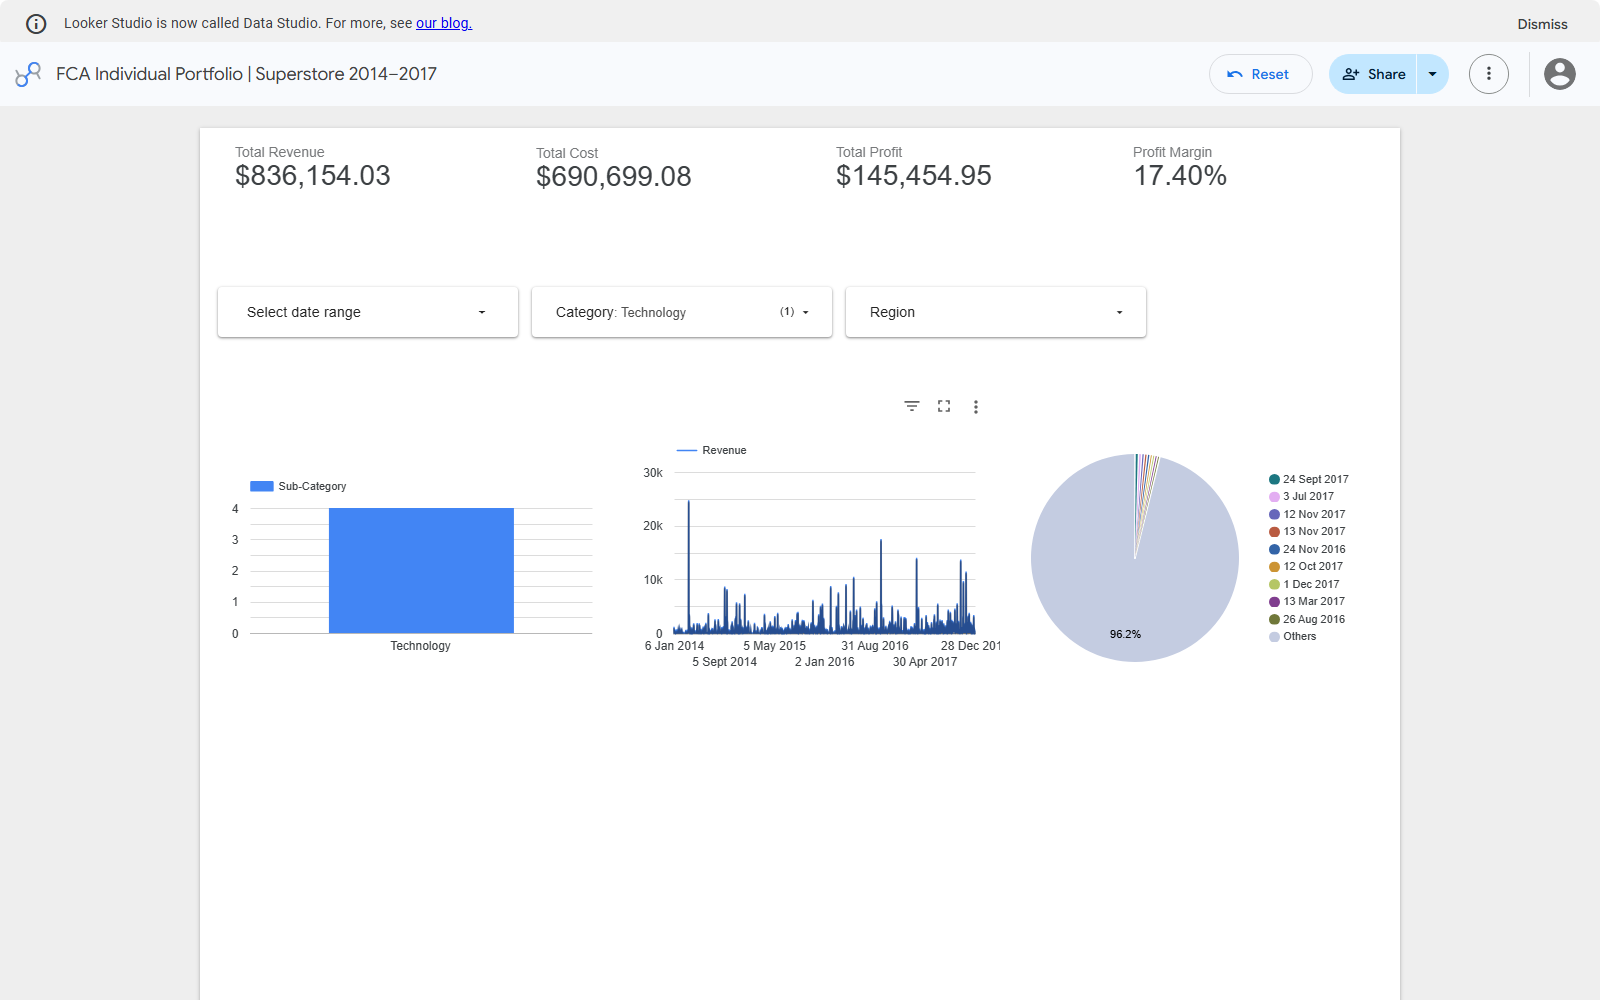
$836,154.03 revenue · $145,454.95 profit · 17.40% margin.
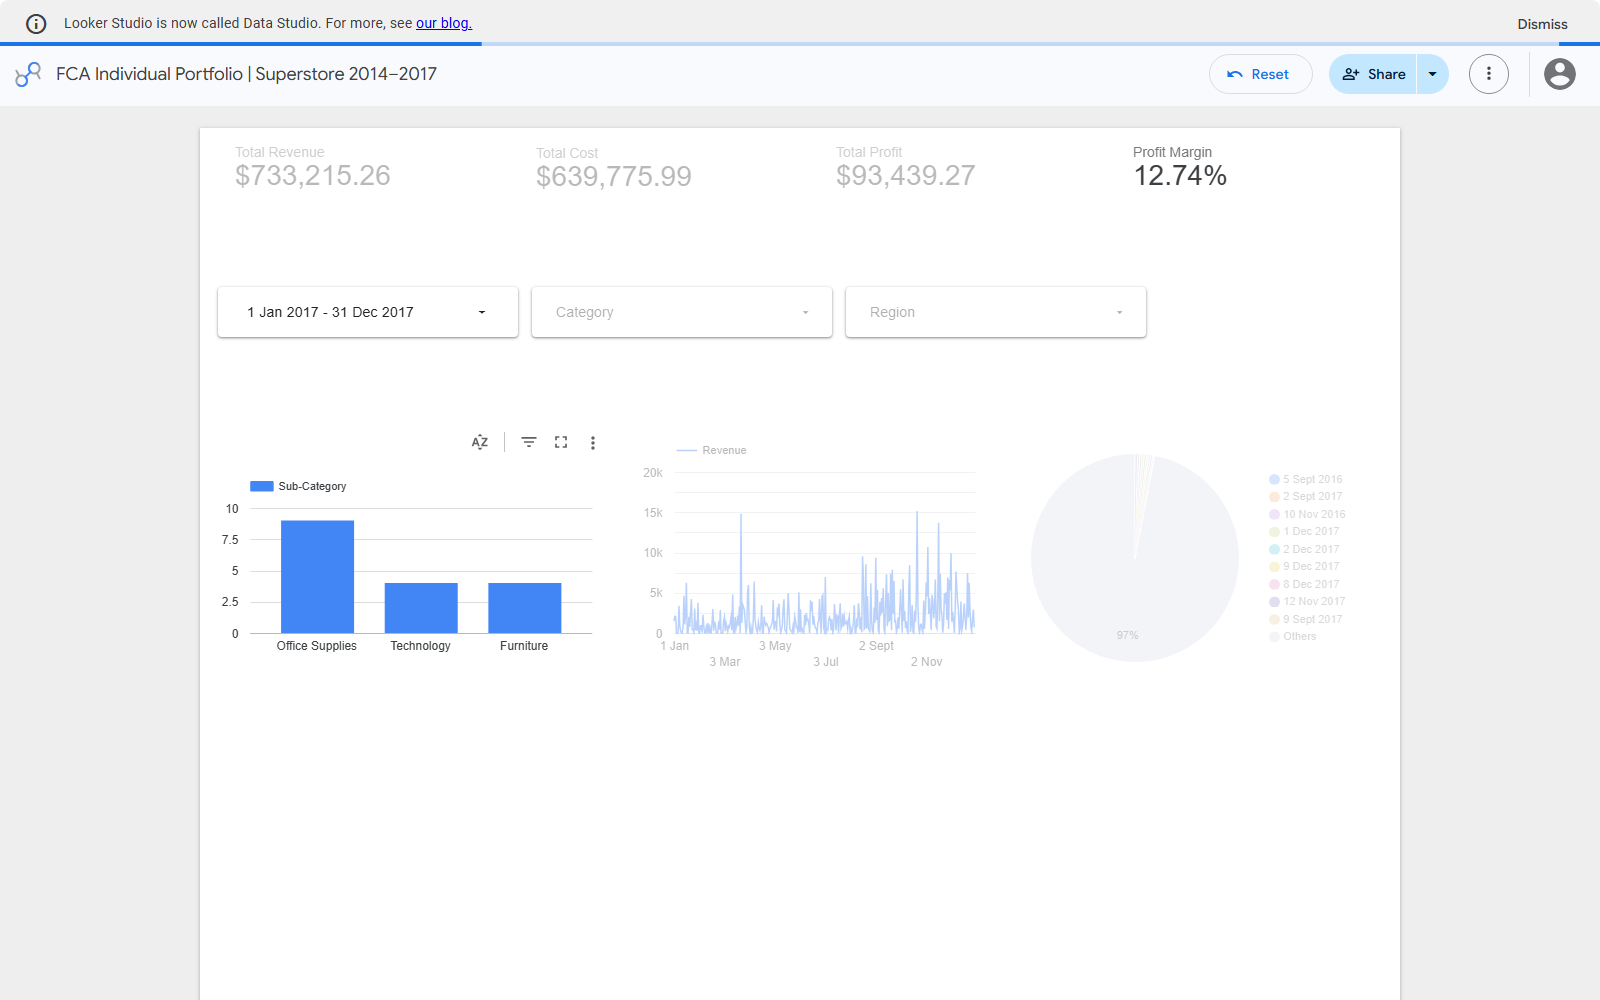
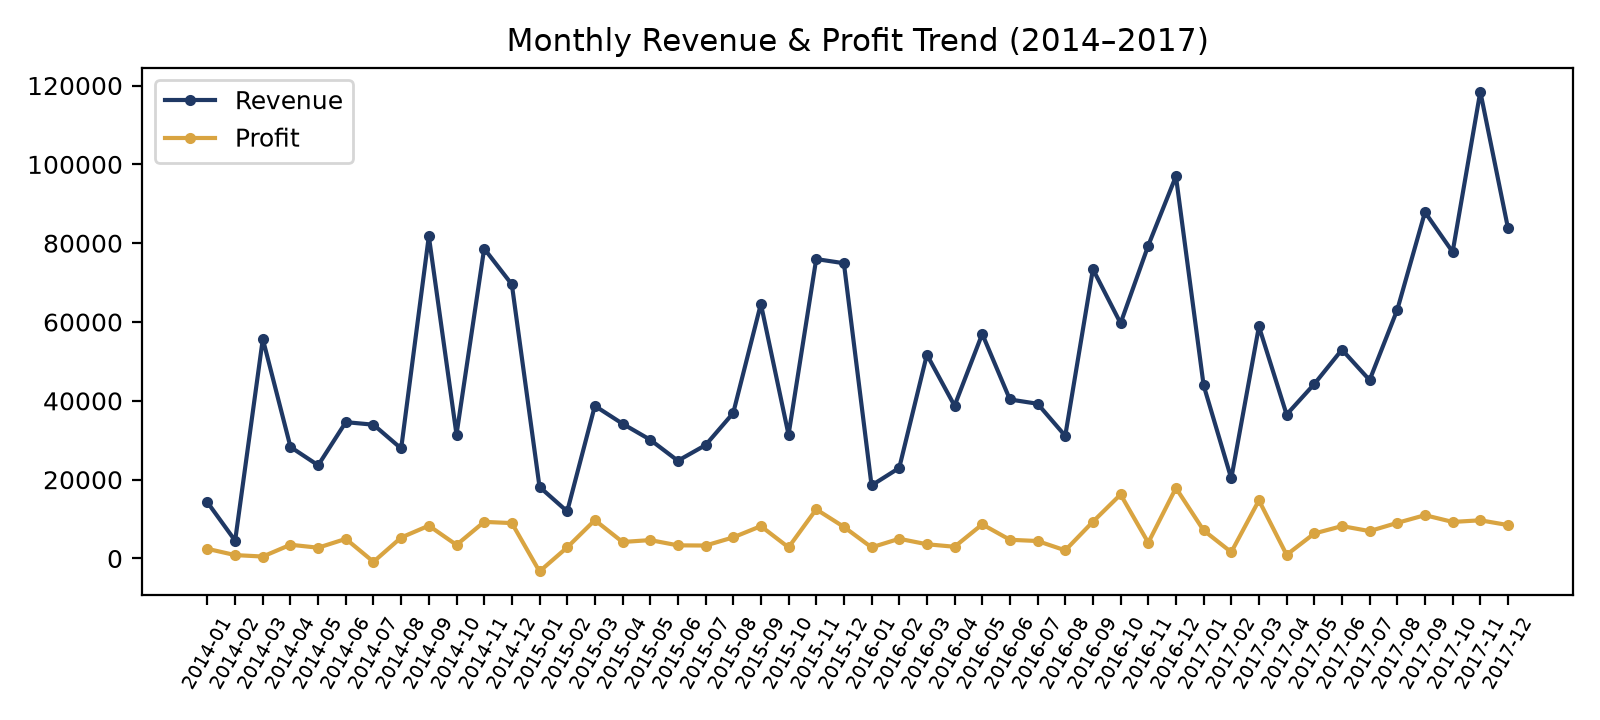
2017: $733,215.26 revenue · $93,439.27 profit · 12.74% margin.
07 / Submission library
Original verified files, with supporting source and evidence documentation.